• RSS
  • Facebook
  • Twitter
Abhijeet
Comments


In physical cosmology, dark energy is a hypothetical exotic form of energy that permeates all of space and tends to increase the rate of expansion of the universe. Dark energy is the most popular way to explain recent observations that the universe appears to be expanding at an accelerating rate. In the standard model of cosmology, dark energy currently accounts for 74% of the total mass-energy of the universe.

Two proposed forms for dark energy are the cosmological constant, a constant energy density filling space homogeneously,and scalar fields such as quintessence or moduli, dynamic quantities whose energy density can vary in time and space. Contributions from scalar fields that are constant in space are usually also included in the cosmological constant. The cosmological constant is physically equivalent to vacuum energy. Scalar fields which do change in space can be difficult to distinguish from a cosmological constant because the change may be extremely slow.

High-precision measurements of the expansion of the universe are required to understand how the expansion rate changes over time. In general relativity, the evolution of the expansion rate is parameterized by the cosmological equation of state. Measuring the equation of state of dark energy is one of the biggest efforts in observational cosmology today.

Adding the cosmological constant to cosmology's standard FLRW metric leads to the Lambda-CDM model, which has been referred to as the "standard model" of cosmology because of its precise agreement with observations. Dark energy has been used as a crucial ingredient in a recent attempt to formulate a cyclic model for the universe.


Evidence for dark energy

[edit] Supernovae

In 1998, observations of type Ia supernovae ("one-A") by the Supernova Cosmology Project at the Lawrence Berkeley National Laboratory and the High-z Supernova Search Team suggested that the expansion of the universe is accelerating.[4][5] Since then, these observations have been corroborated by several independent sources. Measurements of the cosmic microwave background, gravitational lensing, and the large scale structure of the cosmos as well as improved measurements of supernovae have been consistent with the Lambda-CDM model.

Supernovae are useful for cosmology because they are excellent standard candles across cosmological distances. They allow the expansion history of the Universe to be measured by looking at the relationship between the distance to an object and its redshift, which gives how fast it is receding from us. The relationship is roughly linear, according to Hubble's law. It is relatively easy to measure redshift, but finding the distance to an object is more difficult. Usually, astronomers use standard candles: objects for which the intrinsic brightness, the absolute magnitude, is known. This allows the object's distance to be measured from its actually observed brightness, or apparent magnitude. Type Ia supernovae are the best-known standard candles across cosmological distances because of their extreme, and extremely consistent, brightness.

Cosmic Microwave Background

Estimated distribution of dark matter and dark energy in the universe

Estimated distribution of dark matter and dark energy in the universe

The existence of dark energy, in whatever form, is needed to reconcile the measured geometry of space with the total amount of matter in the universe. Measurements of cosmic microwave background (CMB) anisotropies, most recently by the WMAP satellite, indicate that the universe is very close to flat. For the shape of the universe to be flat, the mass/energy density of the universe must be equal to a certain critical density. The total amount of matter in the universe (including baryons and dark matter), as measured by the CMB, accounts for only about 30% of the critical density. This implies the existence of an additional form of energy to account for the remaining 70%. The most recent WMAP observations are consistent with a universe made up of 74% dark energy, 22% dark matter, and 4% ordinary matter. (Note: There is a slight discrepancy in the 'pie chart'.)

Large-Scale Structure

The theory of large scale structure, which governs the formation of structure in the universe (stars, quasars, galaxies and galaxy clusters), also suggests that the density of matter in the universe is only 30% of the critical density.

Late-time Integrated Sachs-Wolfe Effect

Accelerated cosmic expansion causes gravitational potential wells and hills to flatten as photons pass through them, producing cold spots and hot spots on the CMB aligned with vast supervoids and superclusters. This so-called late-time Integrated Sachs-Wolfe effect (ISW) is a direct signal of dark energy in a flat universe, and has recently been detected at high significance by Ho et al. and Giannantonio et al. May 2008, Granett, Neyrinck & Szapudi found arguably the clearest evidence yet for the ISW effect, imaging the average imprint of superclusters and supervoids on the CMB.

Nature of dark energy

The exact nature of this dark energy is a matter of speculation. It is known to be very homogeneous, not very dense and is not known to interact through any of the fundamental forces other than gravity. Since it is not very dense—roughly 10−29 grams per cubic centimeter—it is hard to imagine experiments to detect it in the laboratory. Dark energy can only have such a profound impact on the universe, making up 74% of all energy, because it uniformly fills otherwise empty space. The two leading models are quintessence and the cosmological constant. Both models include the common characteristic that dark energy must have negative pressure.

Negative Pressure

Independently from its actual nature, dark energy would need to have a strong negative pressure in order to explain the observed acceleration in the expansion rate of the universe.

According to General Relativity, the pressure within a substance contributes to its gravitational attraction for other things just as its mass density does. This happens because the physical quantity that causes matter to generate gravitational effects is the Stress-energy tensor, which contains both the energy (or matter) density of a substance and its pressure and viscosity.

In the Friedmann-Lemaître-Robertson-Walker metric, it can be shown that a strong constant negative pressure in all the universe causes an acceleration in universe expansion if the universe is already expanding, or a deceleration in universe contraction if the universe is already contracting. More exactly, the second derivative of the universe scale factor, \ddot{a}, is positive if the equation of state of the universe is such that w < − 1 / 3.

This accelerating expansion effect is sometimes labeled "gravitational repulsion", which is a colorful but possibly confusing expression. In fact a negative pressure does not influence the gravitational interaction between masses - which remains attractive - but rather alters the overall evolution of the universe at the cosmological scale, typically resulting in the accelerating expansion of the universe despite the attraction among the masses present in the universe.

Cosmological constant

The simplest explanation for dark energy is that it is simply the "cost of having space": that is, a volume of space has some intrinsic, fundamental energy. This is the cosmological constant, sometimes called Lambda (hence Lambda-CDM model) after the Greek letter Λ, the symbol used to mathematically represent this quantity. Since energy and mass are related by E = mc2, Einstein's theory of general relativity predicts that it will have a gravitational effect. It is sometimes called a vacuum energy because it is the energy density of empty vacuum. In fact, most theories of particle physics predict vacuum fluctuations that would give the vacuum exactly this sort of energy. This is related to the Casimir Effect, in which there is a small suction into regions where virtual particles are geometrically inhibited from forming (e.g. between plates with tiny separation). The cosmological constant is estimated by cosmologists to be on the order of 10−29g/cm³, or about 10−120 in reduced Planck units. Particle physics predicts a natural value of 1 in reduced Planck units, quite a bit off.

The cosmological constant has negative pressure equal to its energy density and so causes the expansion of the universe to accelerate. The reason why a cosmological constant has negative pressure can be seen from classical thermodynamics; Energy must be lost from inside a container to do work on the container. A change in volume dV requires work done equal to a change of energy −p dV, where p is the pressure. But the amount of energy in a box of vacuum energy actually increases when the volume increases (dV is positive), because the energy is equal to ρV, where ρ (rho) is the energy density of the cosmological constant. Therefore, p is negative and, in fact, p = −ρ.

A major outstanding problem is that most quantum field theories predict a huge cosmological constant from the energy of the quantum vacuum, more than 100 orders of magnitude too large. This would need to be cancelled almost, but not exactly, by an equally large term of the opposite sign. Some supersymmetric theories require a cosmological constant that is exactly zero, which does not help. The present scientific consensus amounts to extrapolating the empirical evidence where it is relevant to predictions, and fine-tuning theories until a more elegant solution is found. Philosophically, our most elegant solution may be to say that if things were different, we would not be here to observe anything — the anthropic principle.Technically, this amounts to checking theories against macroscopic observations. Unfortunately, as the known error-margin in the constant predicts the fate of the universe more than its present state, many such "deeper" questions remain unknown.

Another problem arises with inclusion of the cosmic constant in the standard model: i.e., the appearance of solutions with regions of discontinuities at low matter density. Discontinuity also affects the past sign of the pressure assigned to the cosmic constant, changing from the current negative pressure to attractive, as one looks back towards the early Universe. A systematic, model-independent evaluation of the supernovae data supporting inclusion of the cosmic constant in the standard model indicates these data suffer systematic error. The supernovae data are not overwhelming evidence for an accelerating Universe expansion which may be simply gliding. A numerical evaluation of WMAP and supernovae data for evidence that our local group exists in a local void with poor matter density compared to other locations, uncovered possible conflict in the analysis used to support the cosmic constant These findings should be considered shortcomings of the standard model, but only when a term for vacuum energy is included.

In spite of its problems, the cosmological constant is in many respects the most economical solution to the problem of cosmic acceleration. One number successfully explains a multitude of observations. Thus, the current standard model of cosmology, the Lambda-CDM model, includes the cosmological constant as an essential feature.

Quintessence


In quintessence models of dark energy, the observed acceleration of the scale factor is caused by the potential energy of a dynamical field, referred to as quintessence field. Quintessence differs from the cosmological constant in that it can vary in space and time. In order for it not to clump and form structure like matter, the field must be very light so that it has a large Compton wavelength.

No evidence of quintessence is yet available, but it has not been ruled out either. It generally predicts a slightly slower acceleration of the expansion of the universe than the cosmological constant. Some scientists think that the best evidence for quintessence would come from violations of Einstein's equivalence principle and variation of the fundamental constants in space or time. Scalar fields are predicted by the standard model and string theory, but an analogous problem to the cosmological constant problem (or the problem of constructing models of cosmic inflation) occurs: renormalization theory predicts that scalar fields should acquire large masses.

The cosmic coincidence problem asks why the cosmic acceleration began when it did. If cosmic acceleration began earlier in the universe, structures such as galaxies would never have had time to form and life, at least as we know it, would never have had a chance to exist. Proponents of the anthropic principle view this as support for their arguments. However, many models of quintessence have a so-called tracker behavior, which solves this problem. In these models, the quintessence field has a density which closely tracks (but is less than) the radiation density until matter-radiation equality, which triggers quintessence to start behaving as dark energy, eventually dominating the universe. This naturally sets the low energy scale of the dark energy.

Some special cases of quintessence are phantom energy, in which the energy density of quintessence actually increases with time, and k-essence (short for kinetic quintessence) which has a non-standard form of kinetic energy. They can have unusual properties: phantom energy, for example, can cause a Big Rip.

Alternative ideas

Some theorists think that dark energy and cosmic acceleration are a failure of general relativity on very large scales, larger than superclusters. It is a tremendous extrapolation to think that our law of gravity, which works so well in the solar system, should work without correction on the scale of the universe. Most attempts at modifying general relativity, however, have turned out to be either equivalent to theories of quintessence, or inconsistent with observations. It is of interest to note that if the equation for gravity were to approach r instead of r2 at large, intergalactic distances, then the acceleration of the expansion of the universe becomes a mathematical artifact, negating the need for the existence of Dark Energy.

Alternative ideas for dark energy have come from string theory, brane cosmology and the holographic principle, but have not yet proved as compelling as quintessence and the cosmological constant. On string theory, an article in the journal Nature described:

String theories, popular with many particle physicists, make it possible, even desirable, to think that the observable universe is just one of 10500 universes in a grander multiverse, says [Leonard Susskind, a cosmologist at Stanford University in California]. The vacuum energy will have different values in different universes, and in many or most it might indeed be vast. But it must be small in ours because it is only in such a universe that observers such as ourselves can evolve.

Paul Steinhardt in the same article criticizes string theory's explanation of dark energy stating "...Anthropics and randomness don't explain anything... I am disappointed with what most theorists are willing to accept".

Yet another, "radically conservative" class of proposals aims to explain the observational data by a more refined use of established theories rather than through the introduction of dark energy, focusing, for example, on the gravitational effects of density inhomogeneities or on consequences of electroweak symmetry breaking in the early universe.

Implications for the fate of the universe

Cosmologists estimate that the acceleration began roughly 5 billion years ago. Before that, it is thought that the expansion was decelerating, due to the attractive influence of dark matter and baryons. The density of dark matter in an expanding universe decreases more quickly than dark energy, and eventually the dark energy dominates. Specifically, when the volume of the universe doubles, the density of dark matter is halved but the density of dark energy is nearly unchanged (it is exactly constant in the case of a cosmological constant).

If the acceleration continues indefinitely, the ultimate result will be that galaxies outside the local supercluster will move beyond the cosmic horizon: they will no longer be visible, because their line-of-sight velocity becomes greater than the speed of light. This is not a violation of special relativity, and the effect cannot be used to send a signal between them. (Actually there is no way to even define "relative speed" in a curved spacetime. Relative speed and velocity can only be meaningfully defined in flat spacetime or in sufficiently small (infinitesimal) regions of curved spacetime). Rather, it prevents any communication between them and the objects pass out of contact. The Earth, the Milky Way and the Virgo supercluster, however, would remain virtually undisturbed while the rest of the universe recedes. In this scenario, the local supercluster would ultimately suffer heat death, just as was thought for the flat, matter-dominated universe, before measurements of cosmic acceleration.

There are some very speculative ideas about the future of the universe. One suggests that phantom energy causes divergent expansion, which would imply that the effective force of dark energy continues growing until it dominates all other forces in the universe. Under this scenario, dark energy would ultimately tear apart all gravitationally bound structures, including galaxies and solar systems, and eventually overcome the electrical and nuclear forces to tear apart atoms themselves, ending the universe in a "Big Rip". On the other hand, dark energy might dissipate with time, or even become attractive. Such uncertainties leave open the possibility that gravity might yet rule the day and lead to a universe that contracts in on itself in a "Big Crunch". Some scenarios, such as the cyclic model suggest this could be the case. While these ideas are not supported by observations, they are not ruled out. Measurements of acceleration are crucial to determining the ultimate fate of the universe in big bang theory.

History

The cosmological constant was first proposed by Einstein as a mechanism to obtain a stable solution of the gravitational field equation that would lead to a static universe, effectively using dark energy to balance gravity. Not only was the mechanism an inelegant example of fine-tuning, it was soon realized that Einstein's static universe would actually be unstable because local inhomogeneities would ultimately lead to either the runaway expansion or contraction of the universe. The equilibrium is unstable: if the universe expands slightly, then the expansion releases vacuum energy, which causes yet more expansion. Likewise, a universe which contracts slightly will continue contracting. These sorts of disturbances are inevitable, due to the uneven distribution of matter throughout the universe. More importantly, observations made by Edwin Hubble showed that the universe appears to be expanding and not static at all. Einstein famously referred to his failure to predict the idea of a dynamic universe, in contrast to a static universe, as his greatest blunder. Following this realization, the cosmological constant was largely ignored as a historical curiosity.

Alan Guth proposed in the 1970s that a negative pressure field, similar in concept to dark energy, could drive cosmic inflation in the very early universe. Inflation postulates that some repulsive force, qualitatively similar to dark energy, resulted in an enormous and exponential expansion of the universe slightly after the Big Bang. Such expansion is an essential feature of most current models of the Big Bang. However, inflation must have occurred at a much higher energy density than the dark energy we observe today and is thought to have completely ended when the universe was just a fraction of a second old. It is unclear what relation, if any, exists between dark energy and inflation. Even after inflationary models became accepted, the cosmological constant was thought to be irrelevant to the current universe.

The term "dark energy" was coined by Michael Turner in 1998. By that time, the missing mass problem of big bang nucleosynthesis and large scale structure was established, and some cosmologists had started to theorize that there was an additional component to our universe. The first direct evidence for dark energy came from supernova observations of accelerated expansion, in Riess et al and later confirmed in Perlmutter et al.. This resulted in the Lambda-CDM model, which as of 2006 is consistent with a series of increasingly rigorous cosmological observations, the latest being the 2005 Supernova Legacy Survey. First results from the SNLS reveal that the average behavior (i.e., equation of state) of dark energy behaves like Einstein's cosmological constant to a precision of 10 per cent. Recent results from the Hubble Space Telescope Higher-Z Team indicate that dark energy has been present for at least 9 billion years and during the period preceding cosmic acceleration.


source : Wikipedia

[...]

Categories: ,
Abhijeet
Comments


A quasar (contraction of QUASi-stellAR radio source) is an extremely powerful and distant active galactic nucleus. They were first identified as being high redshift sources of electromagnetic energy, including radio waves and visible light that were point-like, similar to stars, rather than extended sources similar to galaxies. While there was initially some controversy over the nature of these objects, there is now a scientific consensus that a quasar is a compact region 10-10000 Schwarzschild radii across surrounding the central supermassive black hole of a galaxy.


Overview

Quasars show a very high redshift, which is an effect of the expansion of the universe between the quasar and the Earth. When combined with Hubble's law, the implication of the redshift is that the quasars are very distant. To be observable at that distance, the energy output of quasars dwarfs every other astronomical event. The most luminous quasars radiate at a rate that can exceed the output of average galaxies, equivalent to one trillion (1012) suns. This radiation is emitted across the spectrum, almost equally, from X-rays to the far-infrared with a peak in the ultraviolet-optical bands, with some quasars also being strong sources of radio and of gamma-rays. In early optical images, quasars looked like single points of light (i.e. point sources), indistinguishable from stars, except for their peculiar spectra. With infrared telescopes and the Hubble Space Telescope, the "host galaxies" surrounding the quasars have been identified in some cases.[1] These galaxies are normally too dim to be seen against the glare of the quasar, except with these special techniques. Most quasars cannot be seen with small telescopes, but 3C 273, with an average apparent magnitude of 12.9, is an exception. At a distance of 2.44 billion light-years, it is one of the most distant objects directly observable with amateur equipment.

Some quasars display rapid changes in luminosity in the optical and even more rapid in the X-rays, which implies that they are small (Solar System sized or less) as an object cannot change faster than the time it takes light to travel from one end to the other; but relativistic beaming of jets pointed nearly directly toward us explains the most extreme cases. The highest redshift known for a quasar (as of December 2007) is 6.43, which corresponds (assuming the currently-accepted value of 71 for the Hubble Constant) to a distance of approximately 28 billion light-years. (NB there are some subtleties in distance definitions in cosmology, so that distances greater than 13.7 billion light-years, or even greater than 27.4 = 2*13.7 light-years, can occur.)

Quasars are believed to be powered by accretion of material into supermassive black holes in the nuclei of distant galaxies, making these luminous versions of the general class of objects known as active galaxies. Large central masses (106 to 109 Solar masses) have been measured in quasars using 'reverberation mapping'. Several dozen nearby large galaxies, with no sign of a quasar nucleus, have been shown to contain a similar central black hole in their nuclei, so it is thought that all large galaxies have one, but only a small fraction emit powerful radiation and so are seen as quasars. The matter accreting onto the black hole is unlikely to fall directly in, but will have some angular momentum around the black hole that will cause the matter to collect in an accretion disc.

Knowledge of quasars is advancing rapidly. As recently as the 1980s, there was no clear consensus as to their origin.

Properties of quasars

More than 100,000 quasars are known, most from the Sloan Digital Sky Survey. All observed quasar spectra have redshifts between 0.06 and 6.4. Applying Hubble's law to these redshifts, it can be shown that they are between 780 million and 28 billion light-years away. Because of the great distances to the furthest quasars and the finite velocity of light, we see them and their surrounding space as they existed in the very early universe.

Most quasars are known to be farther than three billion light-years away. Although quasars appear faint when viewed from Earth, the fact that they are visible from so far away means that quasars are the most luminous objects in the known universe. The quasar that appears brightest in the sky is 3C 273 in the constellation of Virgo. It has an average apparent magnitude of 12.8 (bright enough to be seen through a small telescope), but it has an absolute magnitude of −26.7. From a distance of about 33 light-years, this object would shine in the sky about as brightly as our sun. This quasar's luminosity is, therefore, about 2 trillion (2 × 10¹²) times that of our sun, or about 100 times that of the total light of average giant galaxies like our Milky Way.

The hyperluminous quasar APM 08279+5255 was, when discovered in 1998, given an absolute magnitude of −32.2, although high resolution imaging with the Hubble Space Telescope and the 10 m Keck Telescope revealed that this system is gravitationally lensed. A study of the gravitational lensing in this system suggests that it has been magnified by a factor of ~10. It is still substantially more luminous than nearby quasars such as 3C 273.

Quasars were much more common in the early universe. This discovery by Maarten Schmidt in 1967 was early strong evidence against the Steady State cosmology of Fred Hoyle, and in favor of the Big Bang cosmology. Quasars show where massive black holes are growing rapidly (via accretion). These black holes grow in step with the mass of stars in their host galaxy in a way not understood at present. One idea is that the jets, radiation and winds from quasars shut down the formation of new stars in the host galaxy, a process called 'feedback'. The jets that produce strong radio emission in some quasars at the centers of clusters of galaxies are known to have enough power to prevent the hot gas in these clusters from cooling and falling down onto the central galaxy.

Quasars are found to vary in luminosity on a variety of time scales. Some vary in brightness every few months, weeks, days, or hours. This means that quasars generate and emit their energy from a very small region, since each part of the quasar would have to be in contact with other parts on such a time scale to coordinate the luminosity variations. As such, a quasar varying on the time scale of a few weeks cannot be larger than a few light-weeks across. The emission of large amounts of power from a small region requires a power source far more efficient than the nuclear fusion which powers stars. The release of gravitational energy by matter falling towards a massive black hole is the only process known that can produce such high power continuously. (Stellar explosions - Supernovas and gamma-ray bursts - can do so, but only for a few minutes.) Black holes were considered too exotic by some astronomers in the 1960s, and they suggested that the redshifts arose from some other (unknown) process, so that the quasars were not really so distant as the Hubble law implied. This 'redshift controversy' lasted for many years. Many lines of evidence (seeing host galaxies, finding 'intervening' absorption lines, gravitational lensing) now demonstrate that the quasar redshifts are due to the Hubble expansion, and quasars are as powerful as first thought.

Quasars have all the same properties as active galaxies, but are more powerful: Their Radiation is 'nonthermal' (i.e. not due to a black body), and some (~10%) are observed to also have jets and lobes like those of radio galaxies that also carry significant (but poorly known) amounts of energy in the form of high energy (i.e. rapidly moving, close to the speed of light) particles (either electrons and protons or electrons and positrons). Quasars can be detected over the entire observable electromagnetic spectrum including radio, infrared, optical, ultraviolet, X-ray and even gamma rays. Most quasars are brightest in their rest-frame near-ultraviolet (near the 1216 angstrom (121.6 nm) Lyman-alpha emission line of hydrogen), but due to the tremendous redshifts of these sources, that peak luminosity has been observed as far to the red as 9000 angstroms (900 nm or 0.9 µm), in the near infrared. A minority of quasars show strong radio emission, which originates from jets of matter moving close to the speed of light. When looked at down the jet, these appear as a blazar and often have regions that appear to move away from the center faster than the speed of light (superluminal expansion). This is an optical trick due to the properties of special relativity.

Quasar redshifts are measured from the strong spectral lines that dominate their optical and ultraviolet spectra. These lines are brighter than the continuous spectrum, so they are called 'emission' lines. They have widths of several percent of the speed of light, and these widths are due to Doppler shifts due to the high speeds of the gas emitting the lines. Fast motions strongly indicate a large mass. Emission lines of hydrogen (mainly of the Lyman series and Balmer series), Helium, Carbon, Magnesium, Iron and Oxygen are the brightest lines. The atoms emitting these lines range from neutral to highly ionized. (I.e. many of the electrons are stripped off the ion, leaving it highly charged.) This wide range of ionization shows that the gas is highly irradiated by the quasar, not merely hot, and not by stars, which cannot produce such a wide range of ionization

Iron Quasars show strong emission lines resulting from low ionization iron (FeII), such as IRAS 18508-7815.

Quasar emission generation

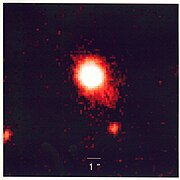
This view, taken with infrared light, is a false-color image of a quasar-starburst tandem with the most luminous starburst ever seen in such a combination.

This view, taken with infrared light, is a false-color image of a quasar-starburst tandem with the most luminous starburst ever seen in such a combination.

Since quasars exhibit properties common to all active galaxies, the emissions from quasars can be readily compared to those of small active galaxies powered by supermassive black holes. To create a luminosity of 1040 W (the typical brightness of a quasar), a super-massive black hole would have to consume the material equivalent of 10 stars per year. The brightest known quasars devour 1000 solar masses of material every year. The largest known is estimated to consume matter equivalent to 600 Earths per hour. Quasars 'turn on' and off depending on their surroundings, and since quasars cannot continue to feed at high rates for 10 billion years, after a quasar finishes accreting the surrounding gas and dust, it becomes an ordinary galaxy.

Quasars also provide some clues as to the end of the Big Bang's reionization. The oldest quasars (redshift >~ 6) display a Gunn-Peterson trough and have absorption regions in front of them indicating that the intergalactic medium at that time was neutral gas. More recent quasars show no absorption region but rather their spectra contain a spiky area known as the Lyman-alpha forest. This indicates that the intergalactic medium has undergone reionization into plasma, and that neutral gas exists only in small clouds.

One other interesting characteristic of quasars is that they show evidence of elements heavier than helium, indicating that galaxies underwent a massive phase of star formation, creating population III stars between the time of the Big Bang and the first observed quasars. Light from these stars may have been observed in 2005 using NASA's Spitzer Space Telescope, although this observation remains to be confirmed.

History of quasar observation

The first quasars were discovered with radio telescopes in the late 1950s. Many were recorded as radio sources with no corresponding visible object. Using small telescopes and the Lovell Telescope as an interferometer, they were shown to have a very small angular size. Hundreds of these objects were recorded by 1960 and published in the Third Cambridge Catalogue as astronomers scanned the skies for the optical counterparts. In 1960, radio source 3C 48 was finally tied to an optical object. Astronomers detected what appeared to be a faint blue star at the location of the radio source and obtained its spectrum. Containing many unknown broad emission lines, the anomalous spectrum defied interpretation — a claim by John Bolton of a large redshift was not generally accepted.

In 1962 a breakthrough was achieved. Another radio source, 3C 273, was predicted to undergo five occultations by the moon. Measurements taken by Cyril Hazard and John Bolton during one of the occultations using the Parkes Radio Telescope allowed Maarten Schmidt to optically identify the object and obtain an optical spectrum using the 200-inch Hale Telescope on Mount Palomar. This spectrum revealed the same strange emission lines. Schmidt realized that these were actually spectral lines of hydrogen redshifted at the rate of 15.8 percent. This discovery showed that 3C 273 was receding at a rate of 47,000 km/s. This discovery revolutionized quasar observation and allowed other astronomers to find redshifts from the emission lines from other radio sources. As predicted earlier by Bolton, 3C 48 was found to have a redshift of 37% the speed of light.

The term quasar was coined by Chinese-born U.S. astrophysicist Hong-Yee Chiu in 1964, in Physics Today, to describe these puzzling objects:

So far, the clumsily long name 'quasi-stellar radio sources' is used to describe these objects. Because the nature of these objects is entirely unknown, it is hard to prepare a short, appropriate nomenclature for them so that their essential properties are obvious from their name. For convenience, the abbreviated form 'quasar' will be used throughout this paper.

Hong-Yee Chiu in Physics Today, May, 1964

Later it was found that not all (actually only 10% or so) quasars have strong radio emission (are 'radio-loud'). Hence the name 'QSO' (quasi-stellar object) is used (in addition to 'quasar') to refer to these objects, including the 'radio-loud' and the 'radio-quiet' classes.

One great topic of debate during the 1960s was whether quasars were nearby objects or distant objects as implied by their redshift. It was suggested, for example, that the redshift of quasars was not due to the expansion of space but rather to light escaping a deep gravitational well. However a star of sufficient mass to form such a well would be unstable and in excess of the Hayashi limit. Quasars also show unusual spectral emission lines which were previously only seen in hot gaseous nebulae of low density, which would be too diffuse to both generate the observed power and fit within a deep gravitational well. There were also serious concerns regarding the idea of cosmologically distant quasars. One strong argument against them was that they implied energies that were far in excess of known energy conversion processes, including nuclear fusion. At this time, there were some suggestions that quasars were made of some hitherto unknown form of stable antimatter and that this might account for their brightness. Others speculated that quasars were a white hole end of a wormhole. However, when accretion disc energy-production mechanisms were successfully modeled in the 1970s, the argument that quasars were too luminous became moot and today the cosmological distance of quasars is accepted by almost all researchers.

In 1979 the gravitational lens effect predicted by Einstein's General Theory of Relativity was confirmed observationally for the first time with images of the double quasar 0957+561.

In the 1980s, unified models were developed in which quasars were classified as a particular kind of active galaxy, and a general consensus emerged that in many cases it is simply the viewing angle that distinguishes them from other classes, such as blazars and radio galaxies. The huge luminosity of quasars results from the accretion discs of central supermassive black holes, which can convert on the order of 10% of the mass of an object into energy as compared to 0.7% for the p-p chain nuclear fusion process that dominates the energy production in sun-like stars.

This mechanism also explains why quasars were more common in the early universe, as this energy production ends when the supermassive black hole consumes all of the gas and dust near it. This means that it is possible that most galaxies, including our own Milky Way, have gone through an active stage (appearing as a quasar or some other class of active galaxy depending on black hole mass and accretion rate) and are now quiescent because they lack a supply of matter to feed into their central black holes to generate radiation.


source : Wikipedia

[...]

Categories: ,
Abhijeet
Comments


A plasma display panel (PDP) is a type of flat panel display now commonly used for large TV displays (typically above 37-inch or 940 mm). Many tiny cells located between two panels of glass hold an inert mixture of noble gases. The gas in the cells is electrically turned into a plasma which then excites phosphors to emit light. Plasma displays are commonly confused with LCDs, another lightweight flatscreen display but with very different technology.

History

Plasma displays were first used in PLATO computer terminals.  This PLATO V model illustrates the display's monochromatic orange glow as seen in 1981.

Plasma displays were first used in PLATO computer terminals. This PLATO V model illustrates the display's monochromatic orange glow as seen in 1981.

The plasma video display was co-invented in 1964 at the University of Illinois at Urbana-Champaign by Donald Bitzer, H. Gene Slottow, and graduate student Robert Willson for the PLATO Computer System. The original monochrome (orange, green, yellow) video display panels were very popular in the early 1970s because they were rugged and needed neither memory nor circuitry to refresh the images. A long period of sales decline occurred in the late 1970s as semiconductor memory made CRT displays cheaper than plasma displays. Nonetheless, the plasma displays' relatively large screen size and thin body made them suitable for high-profile placement in lobbies and stock exchanges.

In 1983, IBM introduced a 19-inch (48 cm) orange-on-black monochrome display (model 3290 'information panel') which was able to show four simultaneous IBM 3270 virtual machine (VM) terminal sessions. That factory was transferred in 1987 to startup company Plasmaco, which Dr. Larry F. Weber, one of Dr. Bitzer's students, founded with Stephen Globus, as well as James Kehoe, who was the IBM plant manager.

In 1992, Fujitsu introduced the world's first 21-inch (53 cm) full-color display. It was a hybrid, based upon the plasma display created at the University of Illinois at Urbana-Champaign and NHK STRL, achieving superior brightness.

In 1996, Matsushita Electrical Industries (Panasonic) purchased Plasmaco, its color AC technology, and its American factory. In 1997, Fujitsu introduced the first 42-inch (107 cm) plasma display; it had 852x480 resolution and was progressively scanned. Also in 1997, Pioneer started selling the first plasma television to the public. Many current plasma televisions, thinner and of larger area than their predecessors, are in use. Their thin size allows them to compete with large area projection screens.

Screen sizes have increased since the introduction of plasma displays. The largest plasma video display in the world at the 2008 Consumer Electronics Show in Las Vegas, Nevada, USA, North America was a 150-inch (381 cm) unit manufactured by Matsushita Electrical Industries (Panasonic) standing 6 ft (180 cm) tall by 11 ft (330 cm) wide and expected to initially retail at US$150,000.

Until quite recently, the superior brightness, faster response time, greater color spectrum, and wider viewing angle of color plasma video displays, when compared with LCD televisions, made them one of the most popular forms of display for HDTV flat panel displays. For a long time it was widely believed that LCD technology was suited only to smaller sized televisions, and could not compete with plasma technology at larger sizes, particularly 40 inches (100 cm) and above. Since then, improvements in LCD technology have narrowed the technological gap. The lower weight, falling prices, and often lower electrical power consumption of LCDs make them competitive with plasma television sets. As of late 2006, analysts note that LCDs are overtaking plasmas, particularly in the important 40-inch (1.0 m) and above segment where plasma had previously enjoyed strong dominance. Another industry trend is the consolidation of manufacturers of plasma displays, with around fifty brands available but only five manufacturers. In the 1Q of 2008 a comparison of worldwide TV sales breaks down to 22.1 million for CRT, 21.1 million for LCD, 2.8 million for Plasma, and 124 thousand for rear-projection.

General characteristics

Plasma displays are bright (1000 lux or higher for the module), have a wide color gamut, and can be produced in fairly large sizes, up to 381 cm (150 inches) diagonally. They have a very low-luminance "dark-room" black level compared to the lighter grey of the unilluminated parts of an LCD screen. The display panel is only about 6 cm (2.5 inches) thick, while the total thickness, including electronics, is less than 10 cm (4 inches). Plasma displays use as much power per square meter as a CRT or an AMLCD television. Power consumption varies greatly with picture content, with bright scenes drawing significantly more power than darker ones. Nominal power rating is typically 400 watts for a 50-inch (127 cm) screen. Post-2006 models consume 220 to 310 watts for a 50-inch (127 cm) display when set to cinema mode. Most screens are set to 'shop' mode by default, which draws at least twice the power (around 500-700 watts) of a 'home' setting of less extreme brightness.

The lifetime of the latest generation of plasma displays is estimated at 60,000 hours of actual display time, or 27 years at 6 hours per day. This is the estimated time over which maximum picture brightness degrades to half the original value, not catastrophic failure.

Competing displays include the CRT, OLED, AMLCD, DLP, SED-tv, and field emission flat panel displays. Advantages of plasma display technology are that a large, very thin screen can be produced, and that the image is very bright and has a wide viewing angle.

Functional details

Composition of plasma display panel

Composition of plasma display panel

The xenon and neon gas in a plasma television is contained in hundreds of thousands of tiny cells positioned between two plates of glass. Long electrodes are also sandwiched between the glass plates, in front of and behind the cells. The address electrodes sit behind the cells, along the rear glass plate. The transparent display electrodes, which are surrounded by an insulating dielectric material and covered by a magnesium oxide protective layer, are mounted in front of the cell, along the front glass plate. Control circuitry charges the electrodes that cross paths at a cell, creating a voltage difference between front and back and causing the gas to ionize and form a plasma. As the gas ions rush to the electrodes and collide, photons are emitted.

In a monochrome plasma panel, the ionizing state can be maintained by applying a low-level voltage between all the horizontal and vertical electrodes – even after the ionizing voltage is removed. To erase a cell all voltage is removed from a pair of electrodes. This type of panel has inherent memory and does not use phosphors. A small amount of nitrogen is added to the neon to increase hysteresis.

In color panels, the back of each cell is coated with a phosphor. The ultraviolet photons emitted by the plasma excite these phosphors to give off colored light. The operation of each cell is thus comparable to that of a fluorescent lamp.

Every pixel is made up of three separate subpixel cells, each with different colored phosphors. One subpixel has a red light phosphor, one subpixel has a green light phosphor and one subpixel has a blue light phosphor. These colors blend together to create the overall color of the pixel, analogous to the "triad" of a shadow-mask CRT. By varying the pulses of current flowing through the different cells thousands of times per second, the control system can increase or decrease the intensity of each subpixel color to create billions of different combinations of red, green and blue. In this way, the control system can produce most of the visible colors. Plasma displays use the same phosphors as CRTs, which accounts for the extremely accurate color reproduction.

Contrast ratio claims

Contrast ratio is the difference between the brightest and darkest parts of an image, measured in discrete steps, at any given moment. Generally, the higher the contrast ratio, the more realistic the image is. Contrast ratios for plasma displays are often advertised as high as 1,000,000:1. On the surface, this is a significant advantage of plasma over display technologies other than OLED. Although there are no industry-wide guidelines for reporting contrast ratio, most manufacturers follow either the ANSI standard or perform a full-on-full-off test. The ANSI standard uses a checkered test pattern whereby the darkest blacks and the lightest whites are simultaneously measured, yielding the most accurate "real-world" ratings. In contrast, a full-on-full-off test measures the ratio using a pure black screen and a pure white screen, which gives higher values but does not represent a typical viewing scenario. Manufacturers can further artificially improve the reported contrast ratio by increasing the contrast and brightness settings to achieve the highest test values. However, a contrast ratio generated by this method is misleading, as content would be essentially unwatchable at such settings.

Plasma is often cited as having better black levels (and contrast ratios), although both plasma and LCD have their own technological challenges. Each cell on a plasma display has to be precharged before it is due to be illuminated (otherwise the cell would not respond quickly enough) and this precharging means the cells cannot achieve a true black. Some manufacturers have worked hard to reduce the precharge and the associated background glow, to the point where black levels on modern plasmas are starting to rival CRT. With LCD technology, black pixels are generated by a light polarization method and are unable to completely block the underlying backlight.

Screen burn-in

See also: Phosphor burn-in
An example of a plasma display that has suffered severe burn-in from stationary text

An example of a plasma display that has suffered severe burn-in from stationary text

With phosphor-based electronic displays (including cathode-ray and plasma displays), the prolonged display of a menu bar or other graphical elements over time can create a permanent ghost-like image of these objects. This is due to the fact that the phosphor compounds which emit the light lose their luminosity with use. As a result, when certain areas of the display are used more frequently than others, over time the lower luminosity areas become visible to the naked eye and the result is called burn-in. While a ghost image is the most noticeable effect, a more common result is that the image quality will continuously and gradually decline as luminosity variations develop over time, resulting in a "muddy" looking picture image.

Plasma displays also exhibit another image retention issue which is sometimes confused with burn-in damage. In this mode, when a group of pixels are run at high brightness (when displaying white, for example) for an extended period of time, a charge build-up in the pixel structure occurs and a ghost image can be seen. However, unlike burn-in, this charge build-up is transient and self corrects after the display has been powered off for a long enough period of time, or after running random broadcast TV type content.

Plasma manufacturers have over time managed to devise ways of reducing the past problems of image retention with solutions involving gray pillarboxes, pixel orbiters and image washing routines.

[...]

Categories:
Abhijeet
Comments


The main sequence is the name for a continuous and distinctive band of stars that appear on a plot of stellar color versus brightness. These color-magnitude plots are known as Hertzsprung-Russell diagrams after their co-developers, Ejnar Hertzsprung and Henry Norris Russell. Stars on this band are known as main-sequence stars or dwarf stars.

After a star has formed, it generates energy at the hot, dense core region through the nuclear fusion of hydrogen atoms into helium. During this stage of the star's lifetime, it is located along the main sequence at a position determined primarily by its mass, but also based upon its chemical composition and other factors. In general, the more massive the star the shorter its lifespan on the main sequence. After the hydrogen fuel at the core has been consumed, the star evolves away from the main sequence.

The main sequence is sometimes divided into upper and lower parts, based on the processes that stars use to generate energy. Stars below about 1.5 times the mass of the Sun (or 1.5 solar masses) fuse hydrogen atoms together in a series of stages to form helium; a sequence called the proton-proton chain. Above this mass, in the upper main sequence, the nuclear fusion process can instead use atoms of carbon, nitrogen and oxygen as intermediaries in the production of helium from hydrogen atoms.

Because there is a temperature gradient between the core of a star and its surface, energy is steadily transported upward through the intervening layers until it is radiated away at the photosphere. The two mechanisms used to carry this energy through the star are radiation and convection, with the type used depending on the local conditions. Convection tends to occur in regions with steeper temperature gradients, higher opacity or both. When convection occurs in the core region it acts to stir up the helium ashes, thus maintaining the proportion of fuel needed for fusion to occur.


History

In the early part of the twentieth century, information about the types and distances of stars became more readily available. The spectra of stars were shown to have distinctive features, which allowed them to be categorized. Annie Jump Cannon and Edward C. Pickering at Harvard College Observatory had developed a method of categorization that became known as the Harvard classification scheme. This scheme was published in the Harvard Annals in 1901.

In Potsdam in 1906, the Danish astronomer Ejnar Hertzsprung noticed that the reddest stars—classified as K and M in the Harvard scheme—could be divided into two distinct groups. These stars are either much brighter than the Sun, or much fainter. To distinguish these groups, he called them "giant" and "dwarf" stars. The following year he began studying star clusters; large groupings of stars that are co-located at approximately the same distance. He published the first plots of color versus luminosity for these stars. These plots showed a prominent and continuous sequence of stars, which he named the main sequence.

At Princeton University, Henry Norris Russell was following a similar course of research. He was studying the relationship between the spectral classification of stars and their actual brightness as corrected for distance—their absolute magnitude. For this purpose he used a set of stars that had reliable parallaxes and many of which had been categorized at Harvard. When he plotted the spectral types of these stars against their absolute magnitude, he found that dwarf stars followed a distinct relationship. This allowed the real brightness of a dwarf star to be predicted with reasonable accuracy.

Of the red stars observed by Hertzsprung, the dwarf stars also followed the spectra-luminosity relationship discovered by Russell. However, the giant stars are much brighter than dwarfs and so do not follow the same relationship. Russell proposed that the "giant stars must have low density or great surface-brightness, and the reverse is true of dwarf stars". The same curve also showed that there were very few faint white stars.

In 1933, Bengt Strömgren introduced the term Hertzsprung-Russell diagram to denote a luminosity-spectral class diagram. This name reflected the parallel development of this technique by both Hertzsprung and Russell earlier in the century.

As evolutionary models of stars were developed during the 1930s, it was shown that, for stars of a uniform chemical composition, a relationship exists between a star's mass and its luminosity and radius. That is, for a given mass and composition is known, there is a unique solution determining the star's radius and luminosity. This became known as the Vogt-Russell theorem; named after Heinrich Vogt and Henry Norris Russell. By this theorem, once a star's chemical composition and its position on the main sequence is known, so too is the star's mass and radius. (However, it was subsequently discovered that the theorem breaks down somewhat for stars of non-uniform composition.)

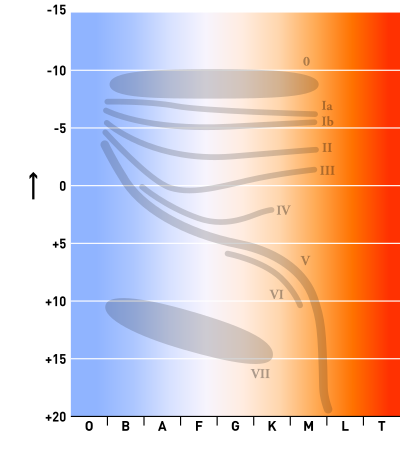
The spectral types of main sequence stars, with mass increasing from right to left.

The spectral types of main sequence stars, with mass increasing from right to left.

A refined scheme for stellar classification was published in 1943 by W. W. Morgan and P. C. Keenan.[6] The MK classification assigned each star a spectral type—based on the Harvard classification—and a luminosity class. For historical reasons, the spectral types of stars followed, in order of decreasing temperature with colors ranging from blue to red, the sequence O, B, A, F, G, K and M. (A popular mnemonic for memorizing this sequence of stellar classes is "Oh Be A Fine Girl/Guy, Kiss Me".) The luminosity class ranged from I to V, in order of decreasing luminosity. Stars of luminosity class V belonged to the main sequence.

Characteristics

Main sequence stars have been extensively studied through stellar models, allowing their formation and evolutionary history to be relatively well understood. The position of the star on the main sequence provides information about its physical properties.

The temperature of a star can be approximately determined by treating it as an idealized energy radiator known as a black body. In this case, the luminosity L and radius R are related to the temperature T by the Stefan-Boltzmann Law:

L = 4πσR2T4

where σ is the Stefan–Boltzmann constant. The temperature and composition of a star's photosphere determines the energy emission at different wavelengths. The color index, or BV, measures the difference in this energy emission by means of filters that capture the star's magnitude in blue (B) and green-yellow (V) light. (By measuring the difference between these values, this eliminates the need to correct the magnitudes for distance.) Thus the position of a star on the HR diagram can be used to estimate its radius and temperature. By modifying the physical properties of the plasma in the photosphere, the temperature of a star also determines its spectral type.

Formation

When a protostar is formed from the collapse of a giant molecular cloud of gas and dust in the local interstellar medium, the initial composition is homogeneous throughout, consisting of about 70% hydrogen, 28% helium and trace amounts of other elements, by mass. During the initial collapse, this pre-main sequence star generates energy through gravitational contraction. Upon reaching a suitable density, energy generation is begun at the core using an exothermic nuclear fusion process that converts hydrogen into helium.

Once nuclear fusion of hydrogen becomes the dominant energy production process and the excess energy gained from gravitational contraction has been lost, the star lies along a curve on the Hertzsprung-Russell diagram (or HR diagram) called the standard main sequence. Astronomers will sometimes refer to this stage as "zero age main sequence", or ZAMS. This curve is calculated using computer models of stellar properties at the point when stars begin hydrogen fusion; the brightness and surface temperature of stars typically increase from this point with age.

A star remains near its initial position on the main sequence until a significant amount of hydrogen in the core has been consumed, then begins to evolve into a more luminous star. (On the HR diagram, the evolving star moves up and to the right of the main sequence.) Thus the main sequence represents the primary hydrogen-burning stage of a star's lifetime.

The majority of stars on a typical HR diagram lie along the main sequence curve. This line is so pronounced because both the spectral type and the luminosity depend only on a star's mass, at least to zeroth order approximation, as long as it is fusing hydrogen at its core—and that is what almost all stars spend most of their "active" life doing. These main-sequence (and therefore "normal") stars are called dwarf stars. This is not because they are unusually small, but instead comes from their smaller radii and lower luminosity as compared to the other main category of stars, the giant stars.[14] White dwarfs are a different kind of star that are much smaller than main sequence stars—being roughly the size of the Earth. These represent the final evolutionary stage of many main sequence stars.

Energy generation

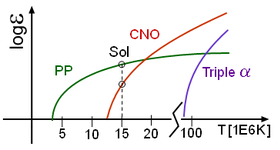
This graph shows the relative energy output for the proton-proton (PP), CNO and triple-α  fusion processes at different temperatures. At the Sun's core temperature, the PP process is more efficient.

This graph shows the relative energy output for the proton-proton (PP), CNO and triple-α fusion processes at different temperatures. At the Sun's core temperature, the PP process is more efficient.

All main sequence stars have a core region where energy is generated by nuclear fusion. The temperature and density of this core are at the levels necessary to sustain the energy production that will support the remainder of the star. A reduction of energy production would cause the overlaying mass to compress the core, resulting in an increase in the fusion rate because of higher temperature and pressure. Likewise an increase in energy production would cause the star to expand, lowering the pressure at the core. Thus the star forms a self-regulating system in hydrostatic equilibrium that is stable over the course of its main sequence lifetime.

Astronomers divide the main sequence into upper and lower parts, based on the dominant type of fusion process at the core. Stars in the upper main sequence have sufficient mass to use the CNO cycle to fuse hydrogen into helium. This process uses atoms of carbon, nitrogen and oxygen as intermediaries in the fusion process. In the lower main sequence, energy is generated as the result of the proton-proton chain, which directly fuses hydrogen together in a series of stages to produce helium.

At a stellar core temperature of 18 million kelvins, both fusion processes are equally efficient. This is the core temperature of a star with 1.5 solar masses. Hence the upper main sequence consists of stars above this mass. The apparent upper limit for a main sequence star is 120-200 solar masses. Stars above this mass can not radiate energy fast enough to remain stable, so any additional mass will be ejected in a series of pulsations until the star reaches a stable limit. The lower limit for sustained nuclear fusion is about 0.08 solar masses.

Structure

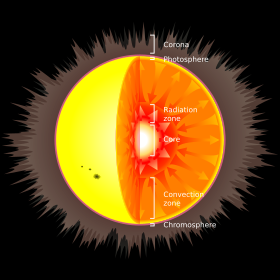
This diagram shows a cross-section of a Sun-like star, showing the internal structure.

This diagram shows a cross-section of a Sun-like star, showing the internal structure.

Because there is a temperature difference between the core and the surface, or photosphere, energy is transported outward. The two modes for transporting this energy are radiation and convection. A radiation zone, where energy is transported by radiation, is stable against convection and there is very little mixing of the plasma. By contrast, in a convection zone the energy is transported by bulk movement of plasma, with hotter material rising and cooler material descending. Convection is a more efficient mode for carrying energy than radiation, but it will only occur under conditions that create a steep temperature gradient.

In massive stars, the rate of energy generation by the CNO cycle is very sensitive to temperature, so the fusion is highly concentrated at the core. Consequently, there is a high temperature gradient in the core region, which results in a convection zone for more efficient energy transport. This mixing of material around the core removes the helium ash from the hydrogen burning region, allowing more of the hydrogen in the star to be consumed during the main sequence lifetime. The outer regions of a massive star transport energy by radiation, with little or no convection.

Intermediate mass, class A stars such as Sirius may transport energy entirely by radiation.Medium-sized, low mass stars like the Sun have a core region that is stable against convection, with a convection zone near the surface. This produces mixing of the outer layers, but results in a less efficient consumption of the hydrogen in the star. This causes a steady buildup of a helium-rich core, surrounded by a hydrogen-rich outer region. By contrast, cool, low-mass stars are convective throughout. Thus the helium produced at the core is distributed across the star, producing a relatively uniform atmosphere and a proportionately longer main sequence lifespan.

Luminosity-color variation

As non-fusing helium ash accumulates in the core, the reduction in the abundance of hydrogen per unit mass results in a gradual lowering of the fusion rate within that mass. To compensate, the core temperature and pressure slowly increase, which actually causes a net increase in the overall fusion rate (to support the greater density of the inner star). This produces a steady increase in the luminosity and radius of the star over time. Thus, for example, the luminosity of the early Sun was only about 70% of its current value.As a star ages, the luminosity increase changes its position on the HR diagram. This effect results in a broadening of the main sequence band because stars are observed at random stages in their lifetime.

Other factors that broaden the main sequence band on the HR diagram include uncertainty in the distance to the stars, and the presence of unresolved binary stars that can alter the observed stellar parameters. However, even perfect observation would show a fuzzy main sequence, because mass is not the only parameter that affects a star's color and luminosity. In addition to variations in chemical composition—both because of the initial abundances and the star's evolutionary status,[24] interaction with a close companion, rapid rotation, a magnetic field can also change a main sequence star's position slightly on the HR diagram, to name just a few factors. For example, there are stars that have a very low abundance of elements with higher atomic numbers than helium—known as metal-poor stars—that lie just below the main sequence. Known as subdwarfs, these stars are also fusing hydrogen in their core and so they mark the lower edge of the main sequence's fuzziness due to chemical composition.

A nearly vertical region of the HR diagram, known as the instability strip, is occupied by pulsating variable stars. These stars vary in magnitude at regular intervals, giving them a pulsating appearance. The strip intersects the upper part of the main sequence in the region of class A and F stars; which are between one and two solar masses. However, main sequence stars in this region experience only small variations in magnitude and so are hard to detect.

Lifetime

The lifespan that a star spends on the main sequence is governed by two factors. The total amount of energy that can be generated through nuclear fusion of hydrogen is limited by the amount of available hydrogen fuel that can be consumed at the core. For a star in equilibrium, the energy generated at the core must be at least equal to the energy radiated at the surface. Since the luminosity gives the amount of energy radiated per unit time, the total life span can be estimated, to first approximation, as the total energy produced divided by the star's luminosity.

Our Sun has been a main sequence star for about 4.5 billion years and will continue to be one for another 5.5 billion years, for a total main sequence lifetime of 1010 years. After the hydrogen supply in the core is exhausted, it will expand to become a red giant and fuse helium atoms to form carbon. As the energy output of the helium fusion process per unit mass is only about a tenth the energy output of the hydrogen process, this stage will only last for about 10% of a star's total active lifetime. Thus, on average, about 90% of the observed stars will be on the main sequence.

On average, main sequence stars are known to follow an empirical mass-luminosity relationship. The luminosity (L) of the star is proportional to the total mass (M) as the following power law:

\begin{smallmatrix}L\ \propto\ M^{3.5}\end{smallmatrix}

The amount of fuel available for nuclear fusion is proportional to the mass of the star. Thus, the lifetime of a star on the main sequence can be estimated by comparing it to the Sun:

\begin{smallmatrix} \tau_{ms}\ \approx \ 10^{10} \text{years} \cdot \left[ \frac{M}{M_{\bigodot}} \right] \cdot \left[ \frac{L_{\bigodot}}{L} \right]\ =\ 10^{10} \text{years} \cdot \left[ \frac{M_{\bigodot}}{M} \right]^{2.5} \end{smallmatrix}

where M and L are the mass and luminosity of the star, respectively, \begin{smallmatrix}M_{\bigodot}\end{smallmatrix} is a solar mass, \begin{smallmatrix}L_{\bigodot}\end{smallmatrix} is the solar luminosity and τms is the star's estimated main sequence lifetime.

This plot gives an example of the mass-luminosity relationship for zero-age main sequence stars. The mass and luminosity are relative to the present-day Sun.

This plot gives an example of the mass-luminosity relationship for zero-age main sequence stars. The mass and luminosity are relative to the present-day Sun.

This is a counter-intuitive result, as more massive stars have more fuel to burn and might be expected to last longer. Instead, the lightest stars, of less than a tenth of a solar mass, may last over a trillion years. For the heaviest stars, however, this mass-luminosity relationship poorly matches the estimated lifetime, which last at least a few million years. A more accurate representation gives a different function for various ranges of mass.

The mass-luminosity relationship depends on how efficiently energy can be transported from the core to the surface. A higher opacity has an insulating effect that retains more energy at the core, so the star does not need to produce as much energy to remain in hydrostatic equilibrium. By contrast, a lower opacity means energy escapes more rapidly and the star must burn more fuel to remain in equilibrium. Note, however, that a sufficiently high opacity can result in energy transport via convection, which changes the conditions needed to remain in equilibrium.[

In high mass main sequence stars, the opacity is dominated by electron scattering, which is nearly constant with increasing temperature. Thus the luminosity only increases as the cube of the star's mass. For stars below 10 times the solar mass, the opacity becomes dependent on temperature, resulting in the luminosity varying approximately as the fourth power of the star's mass. For very low mass stars, molecules in the atmosphere also contribute to the opacity. Below about 0.5 solar masses, the luminosity of the star varies as the mass to the power of 2.3, producing a flattening of the slope on a graph of mass versus luminosity. Even these refinements are only an approximation, however, and the mass-luminosity relation can vary depending on a star's composition.

Evolutionary tracks

Once a main sequence star consumes the hydrogen at its core, the loss of energy generation causes gravitational collapse to resume. The hydrogen surrounding the core reaches sufficient temperature and pressure to undergo fusion, forming a hydrogen-burning shell surrounding a helium core. In consequence of this change, the outer envelope of the star expands and decreases in temperature, turning it into a red giant. At this point the star is evolving off the main sequence and entering the giant branch. (The path the star now follows across the HR diagram is called an evolutionary track.) The helium core of the star continues to collapse until it is entirely supported by electron degeneracy pressure—a quantum mechanical effect that restricts how closely matter can be compacted. For stars of more than about 0.5 solar masses, the core can reach a temperature where it becomes hot enough to burn helium into carbon via the triple alpha process.

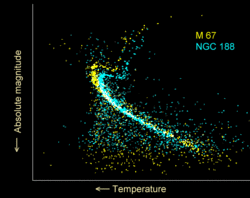
This shows the Hertzsprung-Russell diagrams for two open clusters. NGC 188 is older, and shows a lower turn off from the main sequence than that seen in M67.

This shows the Hertzsprung-Russell diagrams for two open clusters. NGC 188 is older, and shows a lower turn off from the main sequence than that seen in M67.

When a cluster of stars is formed at about the same time, the life span of these stars will depend on their individual masses. The most massive stars will leave the main sequence first, followed steadily in sequence by stars of ever lower masses. Thus the stars will evolve in order of their position on the main sequence, proceeding from the most massive at the left toward the right of the HR diagram. The current position where stars in this cluster are leaving the main sequence is known as the turn-off point. By knowing the main sequence lifespan of stars at this point, it becomes possible to estimate the age of the cluster.

Stellar parameters

The table below shows typical values for stars along the main sequence. The values of luminosity (L), radius (R) and mass (M) are relative to the Sun—a dwarf star with a spectral classification of G2 V. The actual values for a star may vary by as much as 20-30% from the values listed below. The coloration of the stellar class column gives an approximate representation of the star's photographic color, which is a function of the effective surface temperature.


A Hertzsprung-Russell diagram plots the actual brightness (or absolute magnitude) of a star against its color index (represented as B-V). The main sequence is visible as a prominent diagonal band that runs from the upper left to the lower right.

A Hertzsprung-Russell diagram plots the actual brightness (or absolute magnitude) of a star against its color index (represented as B-V). The main sequence is visible as a prominent diagonal band that runs from the upper left to the lower right.
The main sequence is the name for a continuous and distinctive band of stars that appear
Table of main sequence stellar parameters
Stellar
Class
Radius Mass Luminosity Temperature Examples
R/R M/M L/L K
O5 18 40 500,000 38,000 Zeta Puppis
B0 7.4 18 20,000 30,000 Phi1 Orionis
B5 3.8 6.5 800 16,400 Pi Andromedae A
A0 2.5 3.2 80 10,800 Alpha Coronae Borealis A
A5 1.7 2.1 20 8,620 Beta Pictoris
F0 1.4 1.7 6 7,240 Gamma Virginis
F5 1.2 1.29 2.5 6,540 Eta Arietis
G0 1.05 1.10 1.26 6,000 Beta Comae Berenices
G2 1.00 1.00 1.00 5,920 Sun
G5 0.93 0.93 0.79 5,610 Alpha Mensae
K0 0.85 0.78 0.40 5,150 70 Ophiuchi A
K5 0.74 0.69 0.16 61 Cygni A
M0 0.63 0.47 0.063 3,920 Gliese 185[46]
M5 0.32 0.21 0.0079 3,120 EZ Aquarii A
M8 0.13 0.10 0.0008 Van Biesbroeck's star
[...]

Categories: